Sales Reports Daily
The Daily Sales Report shows the daily business performance of your property if you have an eCommerce subscription. The Daily Report details the guests who have occupied your rooms per particular date, and the revenue details per guest room. You can query the Sales Reports by selecting any date from the past in the ‘Go to Date’ dialog. To print a report you can simply click on the ‘Print’ link at the top of the report. To download a report, click on the ‘XLS’ link at the top of the report.
The Daily Sales Report displays the following statistics about your property:
Guest Name: Quickly review the daily revenue summary by Guest Name or Room Number.
Daily Rent: The Daily Rent field shows the Daily Rate paid for that particular room by the guest.
Room Revenue: Room Revenue details the total room revenue derived from that guest for that particular room upon check out. Note: Room Revenue will be blank until the guest has actually checked out of that room, as room revenue is not accrued until check out.
Tax: The Tax field displays the total transient occupancy or room tax paid by the guest. Note: Tax is only shown after check out when all revenue totals are accrued.
#Nights: The # of Nights displays the remaining nights that the guest will be occupying the room. If this field is blank then the guest has checked out on the date of the report.
Phone: The Phone field displays any incidental phone charges for the guest’s stay accrued upon check out.
Misc: The Misc. field displays any incidental miscellaneous charges for the guest’s stay accrued upon check out.
Shop: The Shop field displays any incidental Gift Shop charges for the guest’s stay accrued upon check out.
Cash: The Cash field displays the total amount of cash used to pay for the room and incidental charges by the guest.
Charge Amount: The Charge Amount field displays the total amount paid by credit card for room and incidental charges by the guest. Summing up Cash and Charge Amount totals should equal Room Revenue + Tax + Phone + Misc. + Shop Costs.
The Summary Tables below show all revenue and cost figures totaled and displayed Month to Date so you can track your progress. INNsight.com Reservations show how much revenue is being driven by the INNsight.com Platform.
Lodging Statistics display the following performance metrics of your property:
Room Revenue: Room revenue for the day
Room Occupancy: Total number of rooms occupied
Average Daily Rate: The average rate for the day
Occupancy Rate: A percentage of the total number of rooms that are occupied
RevPAR: How well are you maximizing your real estate? RevPAR or Revenue Per Available Room helps you determine how your real estate is performing. RevPAR is calculated by dividing Room Revenue by the Total Number of Rooms.
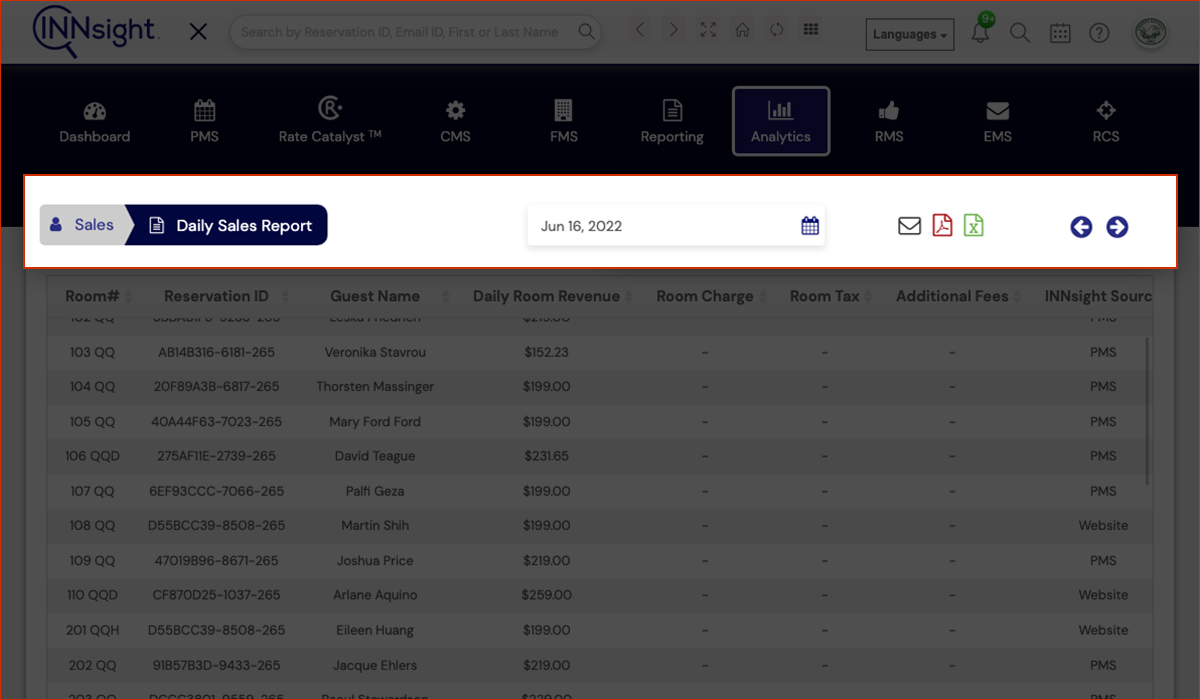
To view your Daily Reports, please follow the below steps.
- Please select the Daily Reports sub-tab from the Analytic section.
.jpg)
- You can view your Daily Analytics reports by altering the required dates and email or download your reports in pdf and spreadsheet formats directly from the same tab.